TL;DR: Among others, Köpings Bostads, Gislavedshus, Kindahus, and Degerforsbyggen.
I'm sure we've all heard of the complete disaster that is the Stockholm housing queue, and a quick look at the official website confirms that "The average time in the queue is 9 years (2023)". That's the kind of shortage for which you would need a second Million Programme to build your way out, and we all know that will never ever happen under today's political and economic climate.
Clearly, to get more favorable odds, we need to go somewhere else where demand is lower and supply is comparatively higher. So it's data analysis time. The good thing here is that some landlord companies believe in transparency and are kind enough to just let us know directly how many people apply to each of their apartments (e.g. "7"). Some examples of that, that you can also see in the Bostadskvant demo, are Karlstads Bostads, Gislavedshus, and Solatum. At the time of writing, they have 2, 61, and 27 vacancies respectively that have zero applicants. And those are just three transparent landlords out of the current total 75. An application (intresseanmälan) is also of course not binding, it just means you will get an invitation to view the place if you're one of the applicants with the longest queue time.
However, 75 is still only around a third of all landlords that currently have active vacancies in my dataset (215 total landlords), and the rest gives us basically nothing to work with. So we have to build a model. My first idea was to look at residents/vacancy, so higher means more competitive. Because logically, that should be a good proxy for the balance between supply and demand. But I first wanted to test this against landlords with visible counts, to see if it's a reasonably reliable proxy. As it turns out, in Lund you currently have 27 vacancies for 98k people, while in Köping you have 37 for 19k, so residents/vacancy is ~7x lower. And sure enough the historic median applicant counts for listings, as seen on their final day before the deadline (median applicants) come in at 59 and 1 respectively. A few other landlord companies that have very low median applicants are Gislavedshus (0), Kindahus (1), and Degerforsbyggen (1).
I unfortunately don't have data for queue times of people who actually ended up signing the leases, as that seems to be a more closely guarded secret, where we only get summaries if we're lucky straight from the source. But I think it's fair to say that if you have no queue time with either, you won't be able to sign in Lund anytime soon, while you can sign in Köping right away.
From these two datapoints and their relationship you might think that where exactly you go doesn't even matter, as long as the population there is small. It doesn't seem to be quite that simple however. Take for example Byggebo, which currently has 23 vacancies in Oskarshamn, a town of 19k, so reasonably comparable to Köping, and yet median applicants is 21 instead of 1.
But let's try to quantify the accuracy of population and residents/vacancy as "obtainability predictors" directly, instead of just cherry-picking examples one way or the other. My way of doing this was to iterate over all pairs of towns, and seeing in what % of comparisons each metric correctly predicts which town will have higher median applicants. So 50% would be no better than guessing at random and 100% would be "perfect", as far as our 150 town sample, with a few weeks of historical listings is concerned. After running the code, we can see that population gets it right 66.4% of the time and residents/vacancy gets it right 79.8% of the time. Though of course that still means getting it wrong one time in five, and I could show a third head-to-head demonstrating this case as well, but you get the point by now.
So applicant count is the reference for judging obtainability, but residents/vacancy is still available as a fallback. However, I quickly discovered that having two "incompatible" metrics that measure the same thing is incredibly inconvenient, so I knew that I had to find a way to try and derive an approximate applicant count from the ratio. The algorithm I ended up making for this worked such that, in principle, it plots every known apartment with residents/vacancy as the x-axis and the final-day applicant count as the y-axis, and then draws a best fit line through all the points on the most suitable log-scales, see image below, with flattened edges.
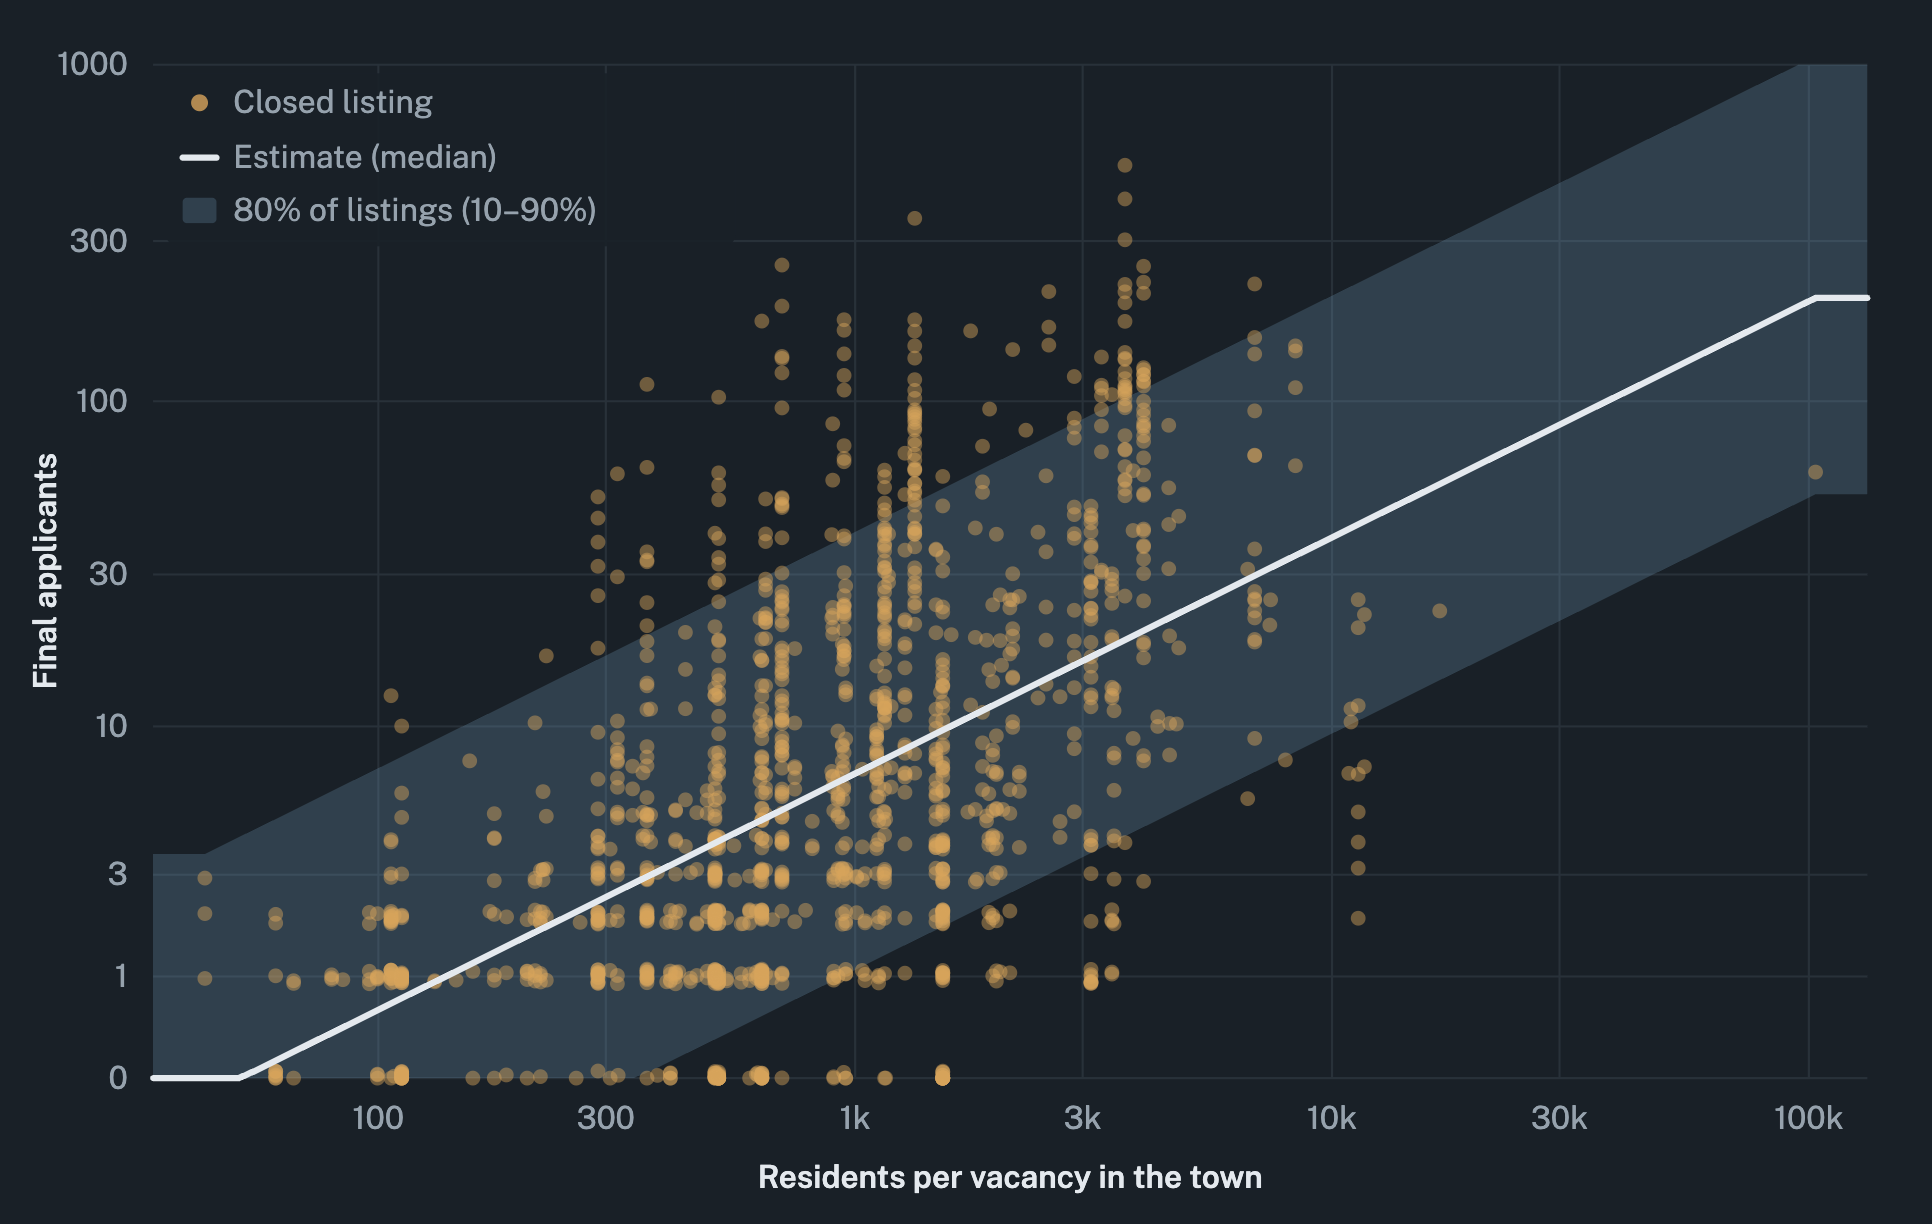
To get some sort of range, I also shifted the line up and down such that the top and bottom 10% of listings are outside the range, but I honestly have to say that it is so wide that I barely look at it in practice. Take for example Enköping, with residents/vacancy of 584. This gives all apartments there an estimated median of 4, but ranging all the way from 0 to 27. That is of course a little bit disheartening, because the wider the range, the less meaningful the median will be for individual apartments. Not to mention listings also get very thin beyond ~5k residents/vacancy, so it becomes quite dubious extrapolation beyond that, but at the end of the day all the information is already very approximate anyway and it's still much better than having nothing at all, I believe. I also tried including actual facts about the apartment as well, but I have yet to find a good predictor of applicant count within the same city. So more research is definitely needed there.
That covers how the estimated applicant count works (e.g. "~7 est."), but there is also an approaching applicant count (e.g. "1 → 3"). Why is this now needed? Logically, plain applicant counts aren't really comparable since they all start at zero and then grow at different rates, depending on how high the demand is. But when you filter by something like "less than 3 applicants", your intuition is that this will be the final tally that doesn't change anymore. A vacancy that's been out for 2 hours is simply not comparable to one that's been out for a week in this regard. The fix for this I already hinted at when I said "grow at different rates", because that's exactly how I chose to fix this problem. Look at historic growth for applicant counts across all historic vacancies over the days, look at the median values, and again simply dubiously extrapolate to predict how many it historically should be, once the deadline arrives.
One thing I have chosen not to consider, but I also don't want to go without mentioning is the metric of "highest applicant score" that 21 landlords expose. That of course tells you how much queue time you would need to be first in line, so in theory something even more precise than raw applicant count, but I personally deem the sample size to be too small for meaningful analysis.
So, in conclusion: If you're willing to look in different places, there are absolutely housing queues where you're competing with barely anyone, like the mentioned Köpings Bostads, Gislavedshus, Kindahus, and Degerforsbyggen. And consider using Bostadskvant to find more of them, by filtering for vacancies with low applicant counts, alongside any other requirements you may have, like features, policies, and amenities.